Overview
Find the probability you need and display it using one of this component's features. You can create tree diagrams, create two way tables, run simulations, find binomial probability, or find geometric probability. For the majority of the features, you will not use data from the data component of your project.
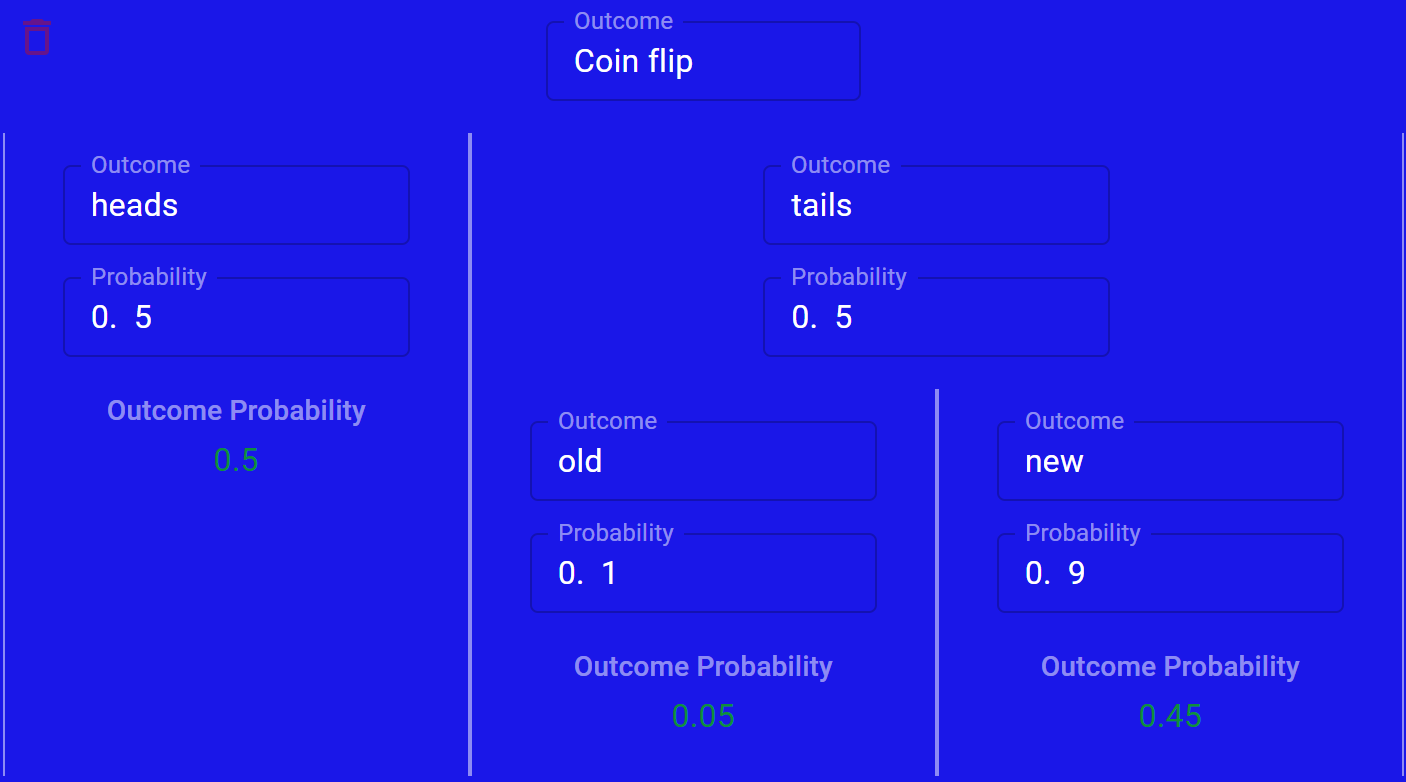
Tree Diagram
The tree diagram allows you to visualize a series of independent events, each branch representing a possible outcome with some probability. There is no limit to how many branches your diagram contains.
Two Way Table
The two way table can be used to illustrate conditional and relative probability of some event. You can choose whether the table displays totals for each row and column, and whether the table displays the frequency or relative probability of each input. Add as many rows and columns as you need!
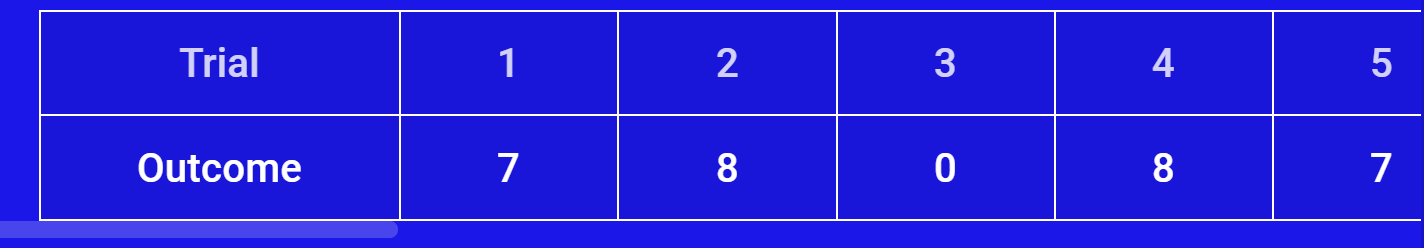
Simulation
The simulation feature will simulate a given number of trials, returning an output from a given number of inputs for each trial. Inputs can either be a range or a given list of inputs from the data component of your project. A table will display the results from each trial and you can optionally display a graph showing the frequency of each outcome.
Binomial Probability
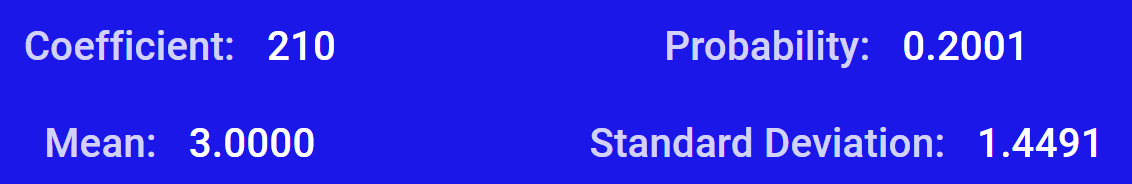
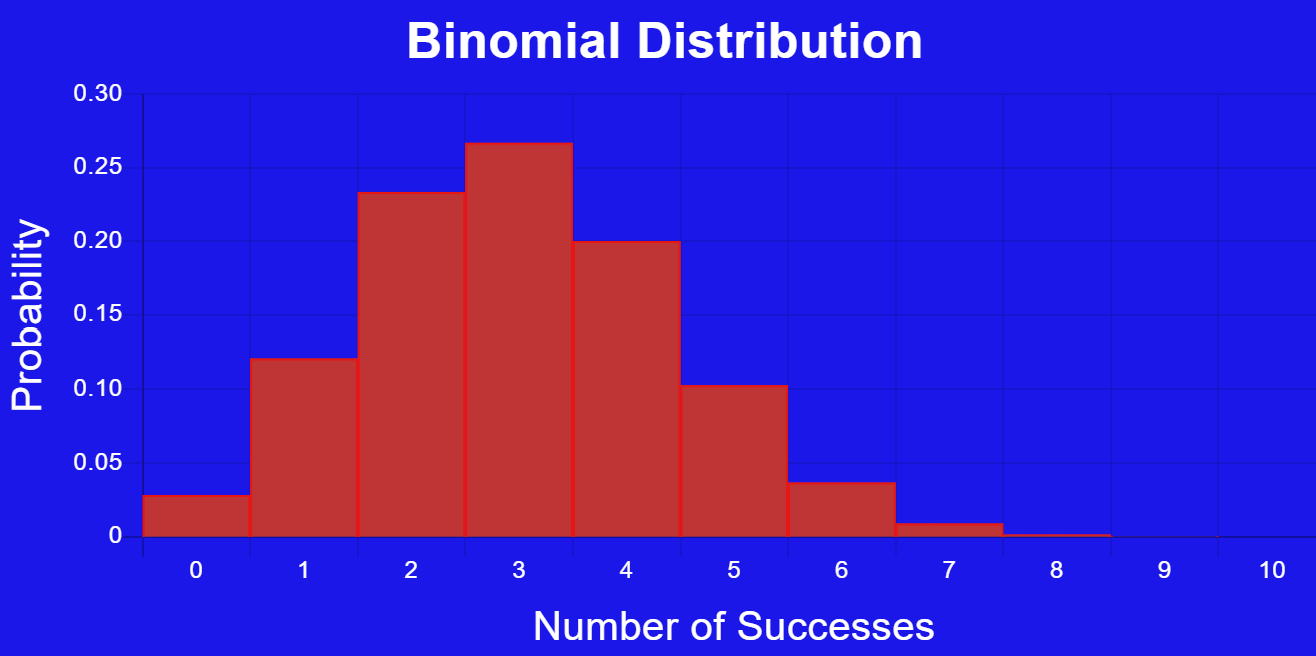
Simply input the number of trials, probability of success, and the number of successes and a probability will be calculated. You can also choose to use binomcdf to calculate the cumulative probability for a number of successful trials. You can optionally display a graph showing the binomial distribution.
Geometric Probability
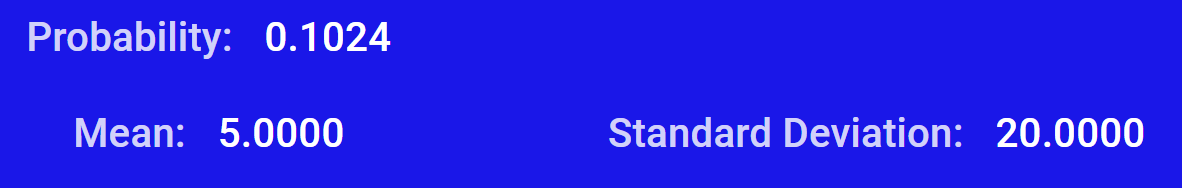
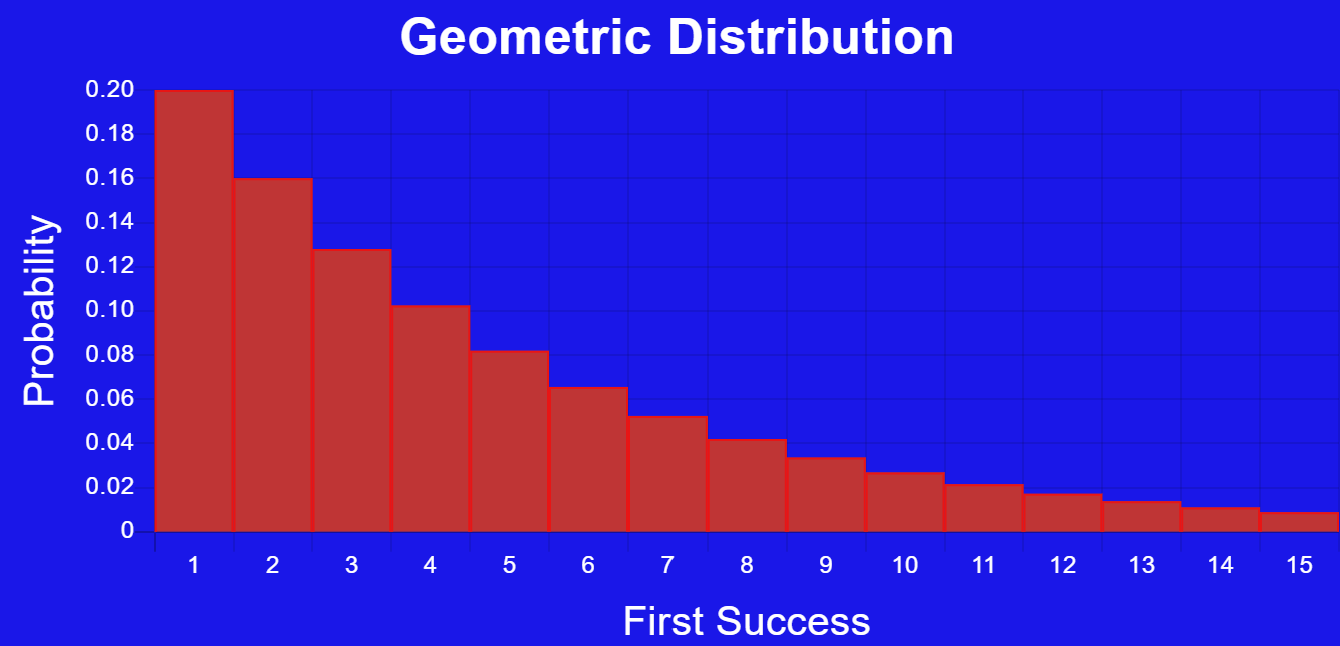
Simply input the number of trials, probability of success, and the trial of the first success and a probability will be calculated. You can also choose to use geometcdf to calculate the cumulative probability for a successful trial. You can optionally display a graph showing the geometric distribution.
Examples
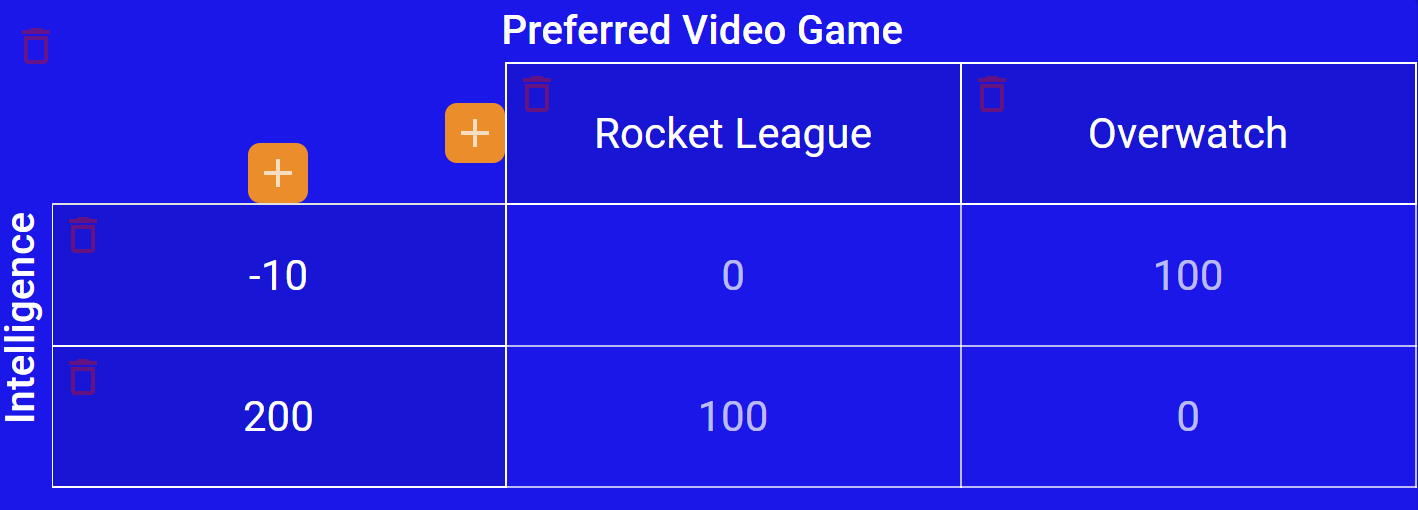
This is a 2 way table
This is a tree diagram
This is a table containing the outcome for each trial in the simulation
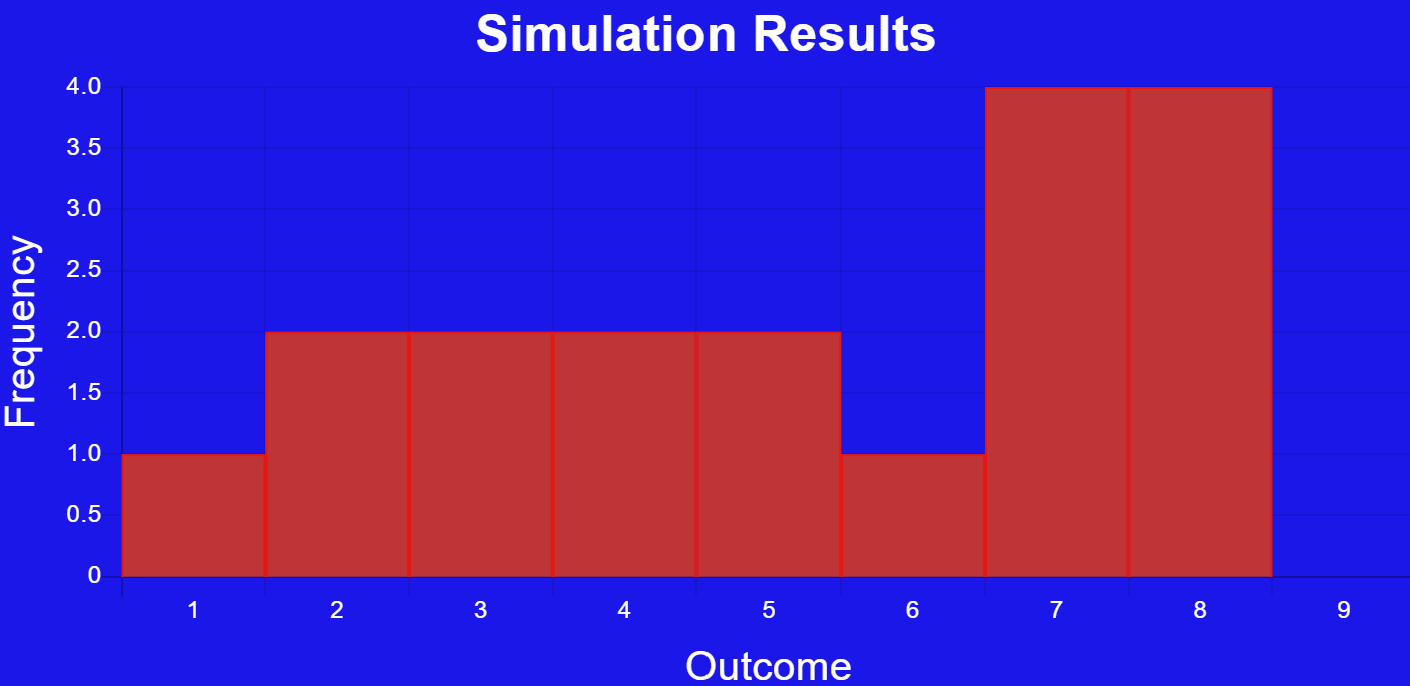
This is a graph showing the frequency of each outcome in the simulation
These are the results from a binomial probability
This is a graph displaying the binomial distribution
These are the results from a geometric probability
This is a graph displaying the geometric distribution