Overview
Create confidence intervals to know how confident you should be about your sample. The intervals you can create using lists from the data component are 1 sample and 2 sample mean/proportion and regression confidence intervals.
1 Sample CI
You can choose to create a one sample confidence intervals for proportion or mean. If you are creating one for a mean, you can either enter in the statistics neccessary from the sample or select a list to represent the sample data. In addition to returning the confidence interval, you can also choose to display a graph of the interval.
2 Sample CI
You can choose to create a two sample confidence intervals for proportion or mean. If you are creating one for a mean, you can either enter in the statistics neccessary from the sample or select 2 lists to represent the data. Like for 1 sample CI, you can also display a graph in addition to the result.
Regression CI
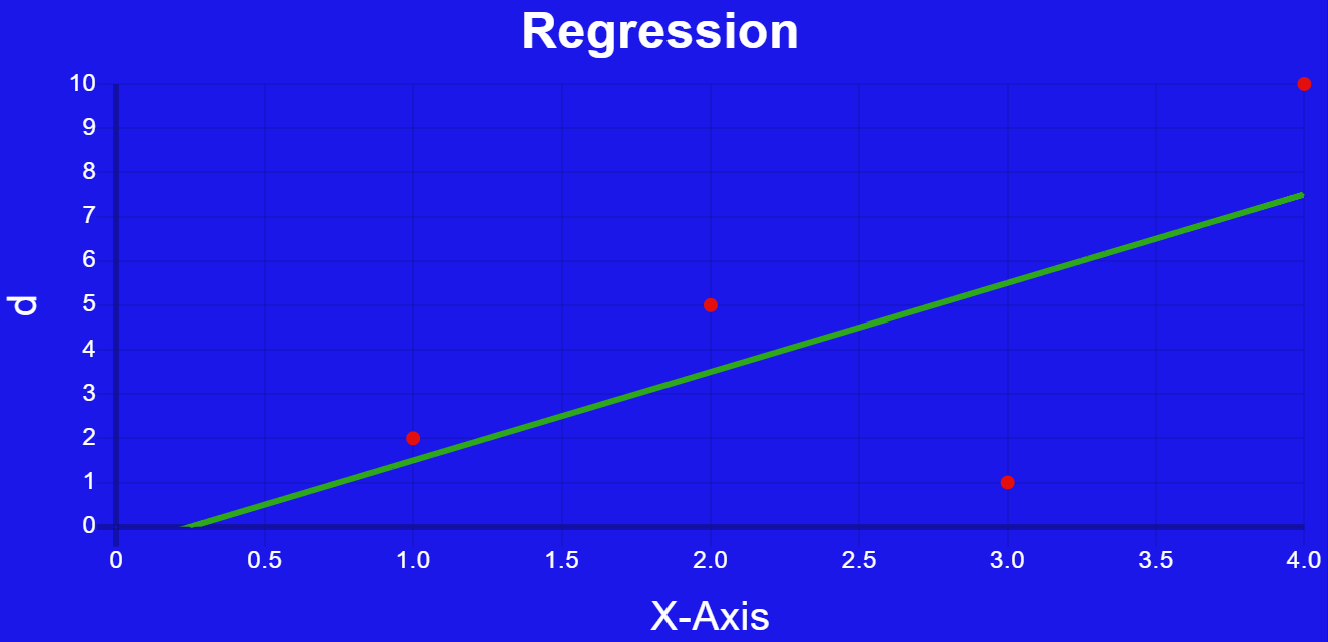
You can create a regression CI by selecting 2 lists from the data component. The test will generate a linear regression for your sample and will give the confidence interval for the slope. Additionally, you can choose to display a graph of the regression.
Examples
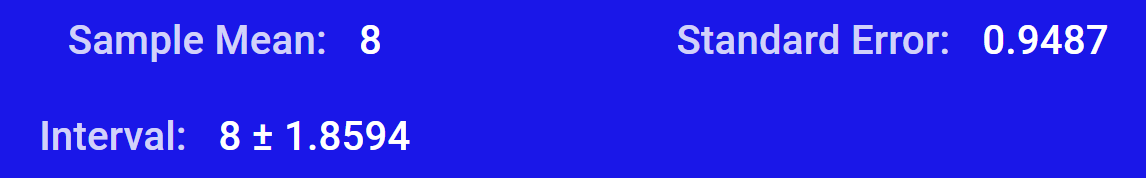
This is the output for a 1 sample confidence interval for a mean
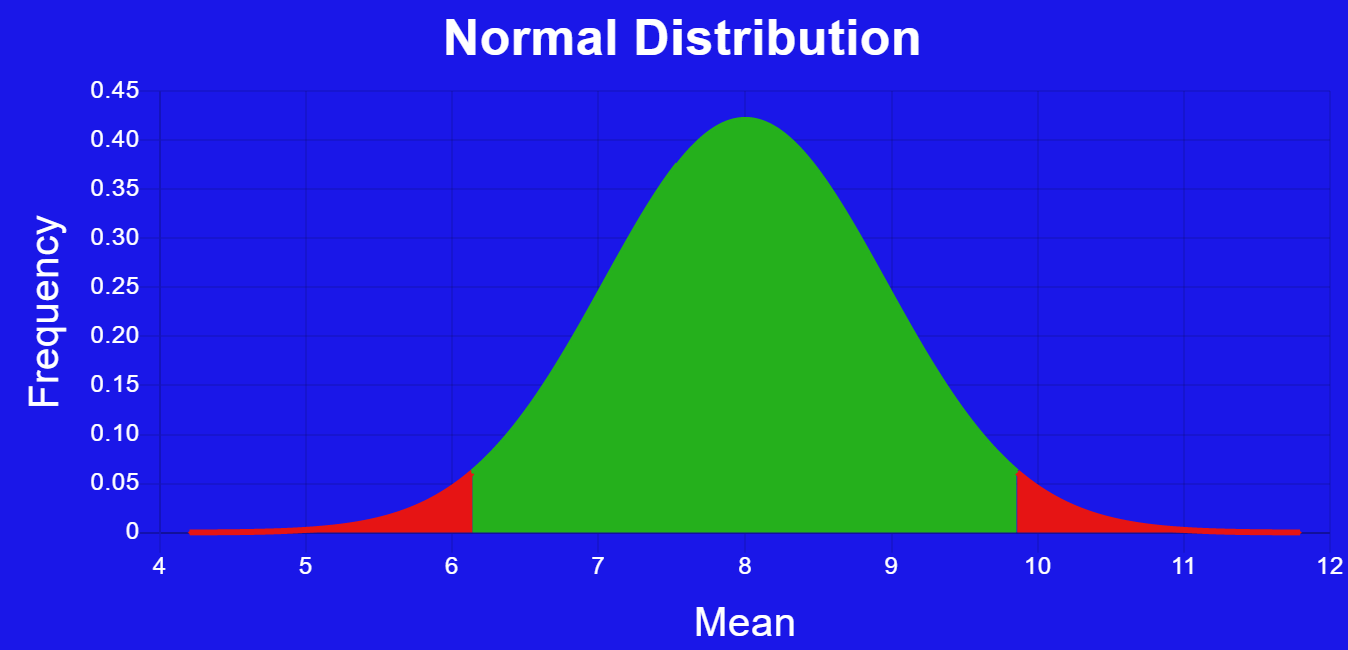
This is a graph of a confidence interval either for a mean or a difference of means. The red area of the curve is for values outside the confidence interval
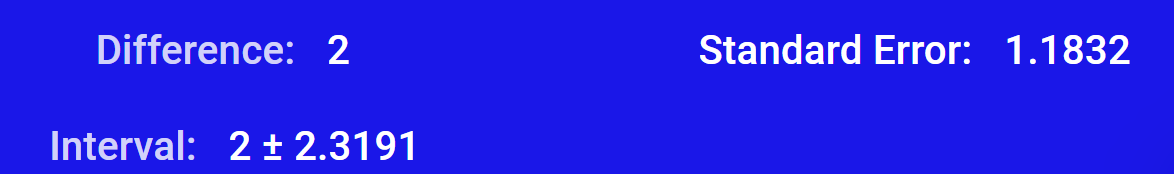
This is the output for a 2 sample confidence interval for the difference of means
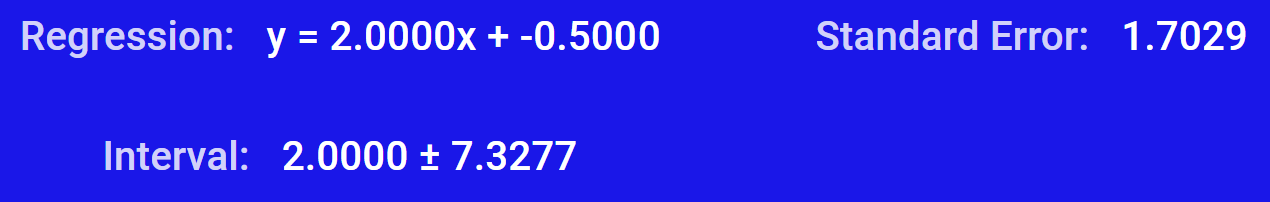
This is the output for a regression confidence interval
This is a graph for a regression confidence interval